")
")
Read-IT
An open place to share expertise, information, opinions and insights on new trends in management control, corporate finance, business intelligence, analytics and web development. All screenshots © of their respective owners.
Wednesday, 10 October 2018 15:08
Free pivot tables
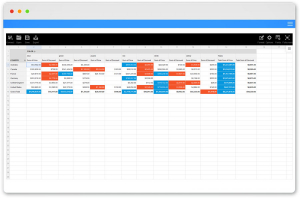
WebDataRocks is a free web reporting tool for data analysis and visualization. It is written in JavaScript and is not constrained by any external framework. This simple but enterprise-featured web-based pivot grid can be added to any website, application or project webpage within minutes. WebDataRocks easily displays every CSV or JSON data in an interactive pivot table, offers a number of data analysis features and provides reporting experience. You get the real-time reporting of your data on any device you prefer (PC, tablet, mobile etc.) with a responsive and modern visualization.
Here follows an interactive demo, based on sample data. This demo includes the files directly from WebDataRocks CDN, but you can also download and use the css and javascript files directly on your server.
More information here: https://www.webdatarocks.com
Download files here: https://www.webdatarocks.com/doc/download/
Published in
controlling
Wednesday, 10 October 2018 13:46
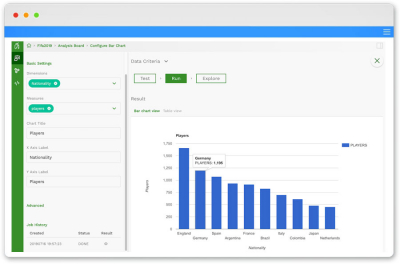
Query2Report analytics
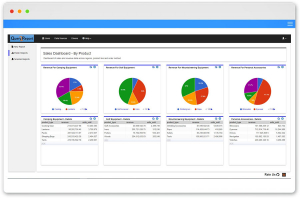
Query2Report is a simple opensource business intelligence solution that allows users to build reports and dashboards for data analytics or corporate reporting. The application transforms SQL queries to beautiful and very impressive Google charts. The application offers automatic refresh functionality for nearly real-time reporting.
The different elements in reports can pull data from multiple databases instance belonging to same or different vendor.
A role based security allows the administrators to create public reports and personal workspaces. Angular JS is used to build this application with a responsive user interface design. It run on laptops, mobiles and tablets.
These are the main features:
More information available here:
https://sourceforge.net/projects/query2report/
where you can also find the download link.
Last version issued on August 4th 2018.
The different elements in reports can pull data from multiple databases instance belonging to same or different vendor.
A role based security allows the administrators to create public reports and personal workspaces. Angular JS is used to build this application with a responsive user interface design. It run on laptops, mobiles and tablets.
These are the main features:
- web based reporting and dashboard generator
- auto refresh for real-time reporting
- public and personal report workspaces
- integrates with any database using JDBC connections
- role based user access
More information available here:
https://sourceforge.net/projects/query2report/
where you can also find the download link.
Last version issued on August 4th 2018.
Published in
analytics
Friday, 30 March 2018 07:27
Leonardo dashboards
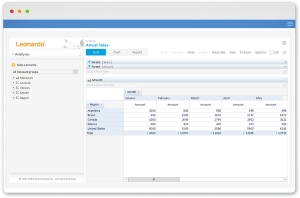
Leonardo by Paris Technologies Inc. delivers dashboards that are not only visually beautiful, but also alive. This means that all information from Leonardo are connected to the actual source of data (OLAP or 3rd party systems). Therefore, data is dynamically refreshed in real-time, from the source.
Leonardo is a web application that is installed on any Windows operating system machine that includes a web server, which delivers Business Intelligence content for your Microsoft-based BI environment to authorized users.
Users can access Leonardo from intranet or internet, depending on environment configuration.Leonardo is a web application that is installed on any Windows operating system machine that includes a web server, which delivers Business Intelligence content for your Microsoft-based BI environment to authorized users.
It takes 5 minutes to download and install Leonardo, for the first time or as a software upgrade.Leonardo is a web application that is installed on any Windows operating system machine that includes a web server, which delivers Business Intelligence content for your Microsoft-based BI environment to authorized users.
Leonardo is accessible from various web browsers and has an intuitive interface that is easy to adopt.Leonardo is a web application that is installed on any Windows operating system machine that includes a web server, which delivers Business Intelligence content for your Microsoft-based BI environment to authorized users.
Interactive dashboards can be accessed from desktop or mobile devices.Leonardo is a web application that is installed on any Windows operating system machine that includes a web server, which delivers Business Intelligence content for your Microsoft-based BI environment to authorized users.
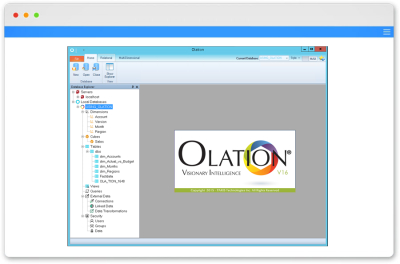
Leonardo is also an OLAP client that can access, browse, and analyze OLAP data and create OLAP reports for multidimensional Olation™ models. Users quickly create interactive business dashboards using already created OLAP analysis or using MDX and SQL queries. Leonardo has features to create and maintain your organization’s KPIs. Users can subscribe to receive dashboard and OLAP analysis at scheduled times.
More details here. Leonardo is offered in the Leonardo suite V18.
Leonardo is a web application that is installed on any Windows operating system machine that includes a web server, which delivers Business Intelligence content for your Microsoft-based BI environment to authorized users.
Users can access Leonardo from intranet or internet, depending on environment configuration.Leonardo is a web application that is installed on any Windows operating system machine that includes a web server, which delivers Business Intelligence content for your Microsoft-based BI environment to authorized users.
It takes 5 minutes to download and install Leonardo, for the first time or as a software upgrade.Leonardo is a web application that is installed on any Windows operating system machine that includes a web server, which delivers Business Intelligence content for your Microsoft-based BI environment to authorized users.
Leonardo is accessible from various web browsers and has an intuitive interface that is easy to adopt.Leonardo is a web application that is installed on any Windows operating system machine that includes a web server, which delivers Business Intelligence content for your Microsoft-based BI environment to authorized users.
Interactive dashboards can be accessed from desktop or mobile devices.Leonardo is a web application that is installed on any Windows operating system machine that includes a web server, which delivers Business Intelligence content for your Microsoft-based BI environment to authorized users.
Leonardo is also an OLAP client that can access, browse, and analyze OLAP data and create OLAP reports for multidimensional Olation™ models. Users quickly create interactive business dashboards using already created OLAP analysis or using MDX and SQL queries. Leonardo has features to create and maintain your organization’s KPIs. Users can subscribe to receive dashboard and OLAP analysis at scheduled times.
More details here. Leonardo is offered in the Leonardo suite V18.
Published in
analytics
Wednesday, 22 March 2017 18:12
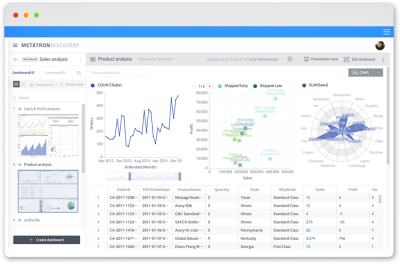
Holistics.io
Holistics Software Pte Ltd is a Singapore company, focused on data preparation and data reporting. Holistics adds synthetic sugar on top of SQL, to extend data extraction flexibility for business reporting.
Embed query variables, conditions, templates and shared filters across all reports and dashboards, to speed up the report creation process. More information available on the Holistics.io website.
Holistics is a commercial close-source product and provides an agile and simple approach to help companies to automate data pipeline process. Holistics helps move multiple data sources into a single data-warehouse, and aggregate/transform them for analytics purpose.
Published in
analytics
Friday, 24 February 2017 21:41
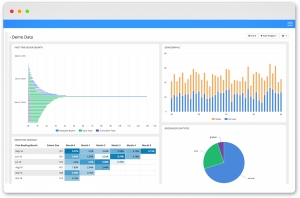
Syncfusion dashboard
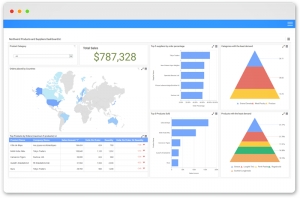
The Syncfusion Dashboard Platform is an end-to-end solution for creating, managing, and sharing interactive professional dashboards.
It includes a powerful dashboard designer client application for easily composing dashboards as well as a web interface for managing and sharing dashboards on-line.
The solution is not open source but the company offers a free community edition to test ad use it in small organizations.
Syncfusion Inc. is a North Carolina company and offers one of the most comprehensive suite of components available for .NET, Javascript, iOS, Android and Xamarin, including grids, diagrams, schedules, gantt controls, maps, gauges, docking, ribbons and much more.
More information here. Information on the community edition.
Published in
analytics
Categories
Search
© 2002 - 2024 Frêney | Freney, S.r.l. - P.Iva: IT03001860166