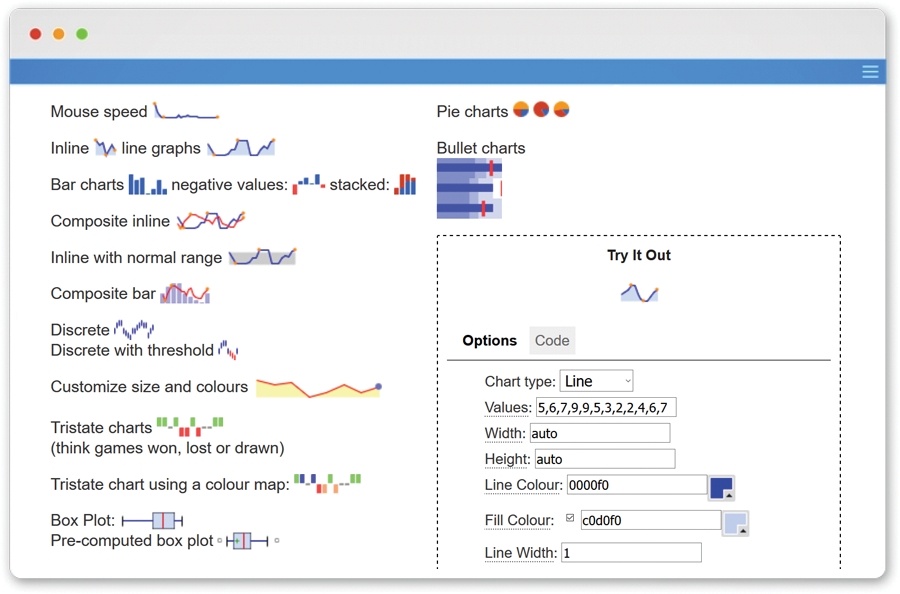
A sparkline is a very small line chart, typically drawn without axes or coordinates. It presents the general shape of the variation (typically over time) in some measurement, such as temperature or stock market price, in a simple and highly condensed way. Sparklines are small enough to be embedded in text, or several sparklines may be grouped together as elements of a small multiple. This is a jQuery plugin to generate sparklines (small inline charts) directly in the browser, using data supplied either inline in the HTML, or via javascript.
The plugin is compatible with most modern browsers and has been tested with Firefox 2+, Safari 3+, Opera 9, Google Chrome and Internet Explorer 6, 7, 8, 9 & 10 as well as iOS and Android.
Last version 2.1.2 was released in June 2013 and can be found here.
Read-IT
An open place to share expertise, information, opinions and insights on new trends in management control, corporate finance, business intelligence, analytics and web development. All screenshots © of their respective owners.
© 2002 - 2025 Frêney | Freney, S.r.l. - P.Iva: IT03001860166


